52 Week Money Challenge 2027 Printable
Save $1,378 in 2027, one weekly deposit at a time.
$1.50 $5.99
Buy on Etsy →




Budget Planners
The one number that matters, tracked monthly.
Net worth is the one number that tells the truth about your money: everything you own minus everything you owe. Not your salary, not your account balance on a good day, the real number. This 14 page printable tracker turns watching that number into a monthly ritual: log it, plot it, and watch it climb. Fifteen minutes a month on the trend line that matters most.
The ritual is the product as much as the pages. Most people never calculate their net worth because no single moment feels like the right time. A monthly page makes the time. And once you have six months of numbers, the trend starts talking to you.
Account balances lie by omission. Your checking account looks healthy the day after payday and scary the day before. Your investment account swings with the market. Neither tells you whether you are actually getting richer or poorer. Net worth includes everything: cash, investments, home equity, minus every debt. It is the whole picture on one line.
That completeness changes decisions. When you see the number move, you start asking which actions move it fastest: paying down the high interest debt, bumping the retirement contribution, or just spending less this month. The tracker does not answer those questions for you. It gives you the number that makes the answers obvious.
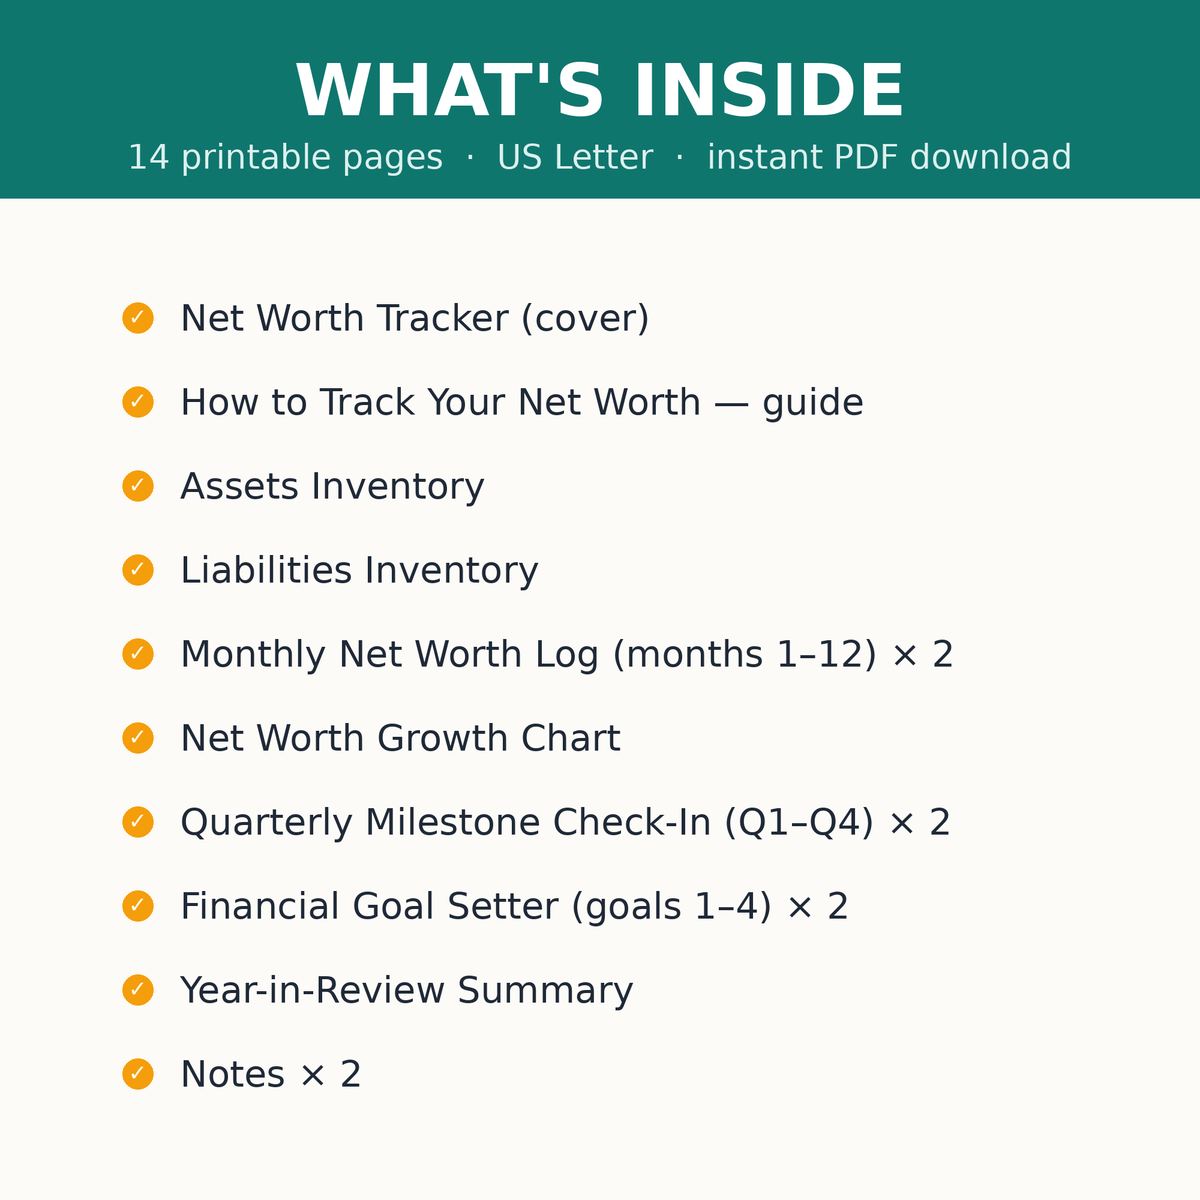
Each month starts with the assets and liabilities inventories: list what you own and what you owe, with current values. Then the 12 month net worth log records the resulting number alongside the prior months. The whole thing takes about fifteen minutes once you have done it twice.
Then the satisfying part: the hand plot growth chart grid. You plot each month's number by hand and connect the dots. A rising line on paper you drew yourself hits differently than a number on a screen. On the months the line dips, the chart keeps you honest instead of letting you look away.
The quarterly check ins ask you to step back every three months and read the trend: what moved the number, what surprised you, what you want to change next quarter. Three months is long enough for real movement and short enough to still act on.
The year in review summary closes the loop. Twelve months of numbers, the starting point versus the ending point, and the financial goal setters for next year. A completed year of this tracker is one of the most motivating documents a person can own, because it is proof, in your own handwriting, that your money moved in the right direction.
This tracker is for anyone who wants to know where they stand financially without building a spreadsheet from scratch. Beginners get a guided way to calculate net worth for the first time. Experienced money trackers get a clean monthly ritual that takes fifteen minutes.
It is especially good for people in the messy middle: paying down debt while building savings, where month to month progress is hard to feel. The trend line shows the progress your daily life hides.
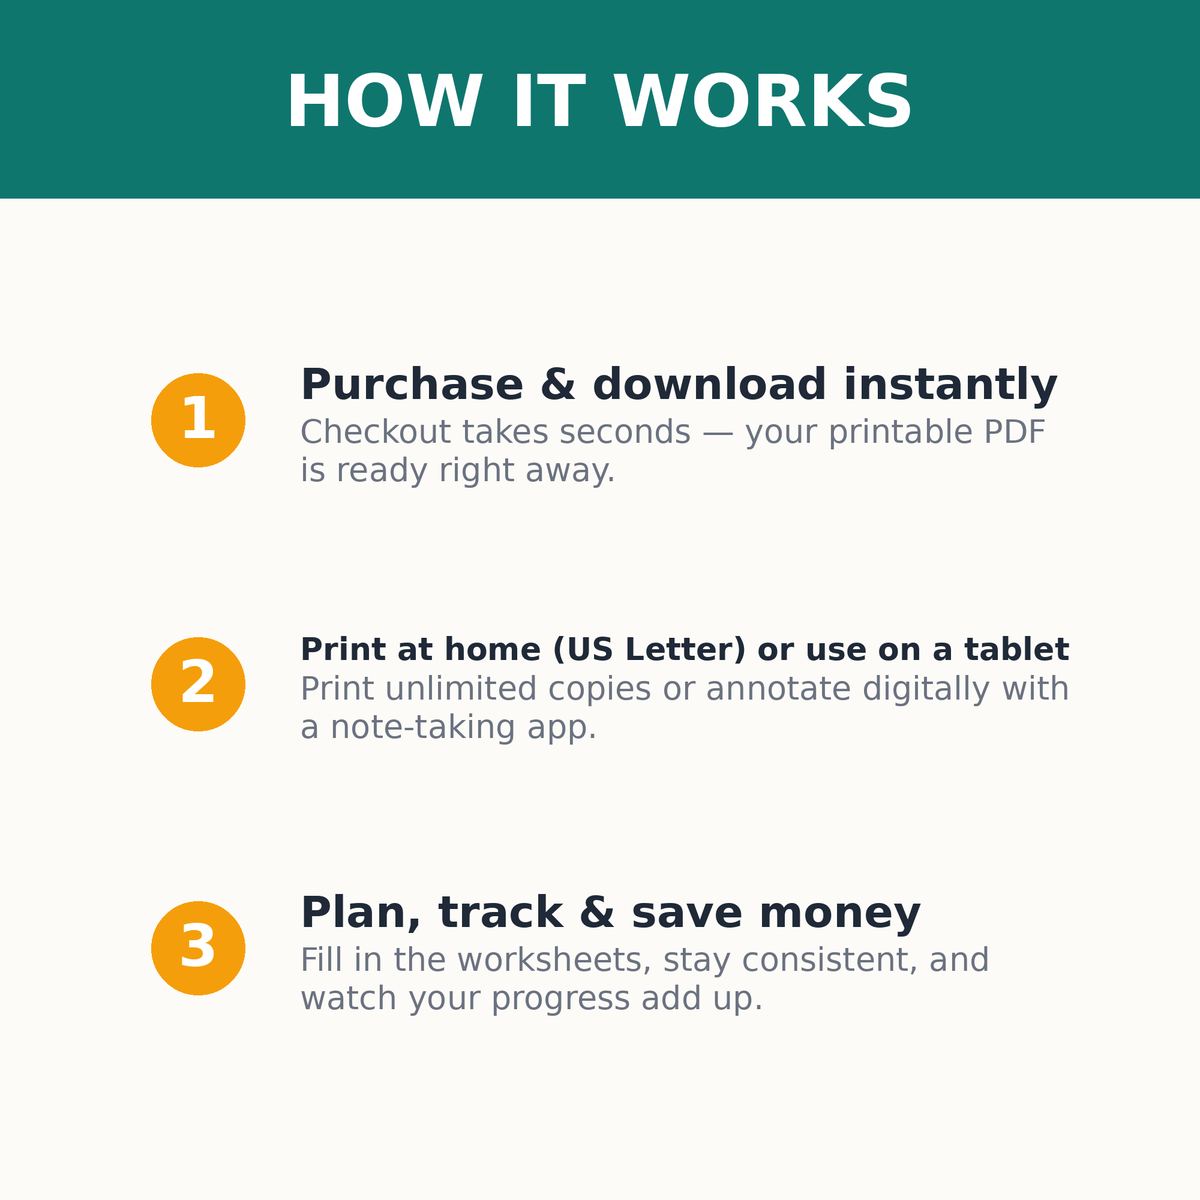
Download and print the tracker. Fill in the assets and liabilities inventories with current values.
Each month, update the values, record your net worth in the 12 month log, and plot the new point on the growth chart.
Do the quarterly check ins, then close the year with the year in review and set next year's goals.
What buyers ask before downloading this planner.
Cash, checking and savings accounts, investment and retirement accounts, home equity, vehicles, and anything else of real value you own. The inventory pages walk you through the common categories.
Yes, at a realistic market value, minus the mortgage balance which goes under liabilities. That gives you your home equity, which is usually the biggest line on the page.
Monthly. More often than that and market noise drowns out the trend. Less often and you lose the ritual.
Then this tracker is exactly what you need. A negative number that climbs toward zero is one of the most motivating trends there is. The chart does not judge; it just shows the direction.
The 12 month log works in order from month one, so you can start any month of the year.
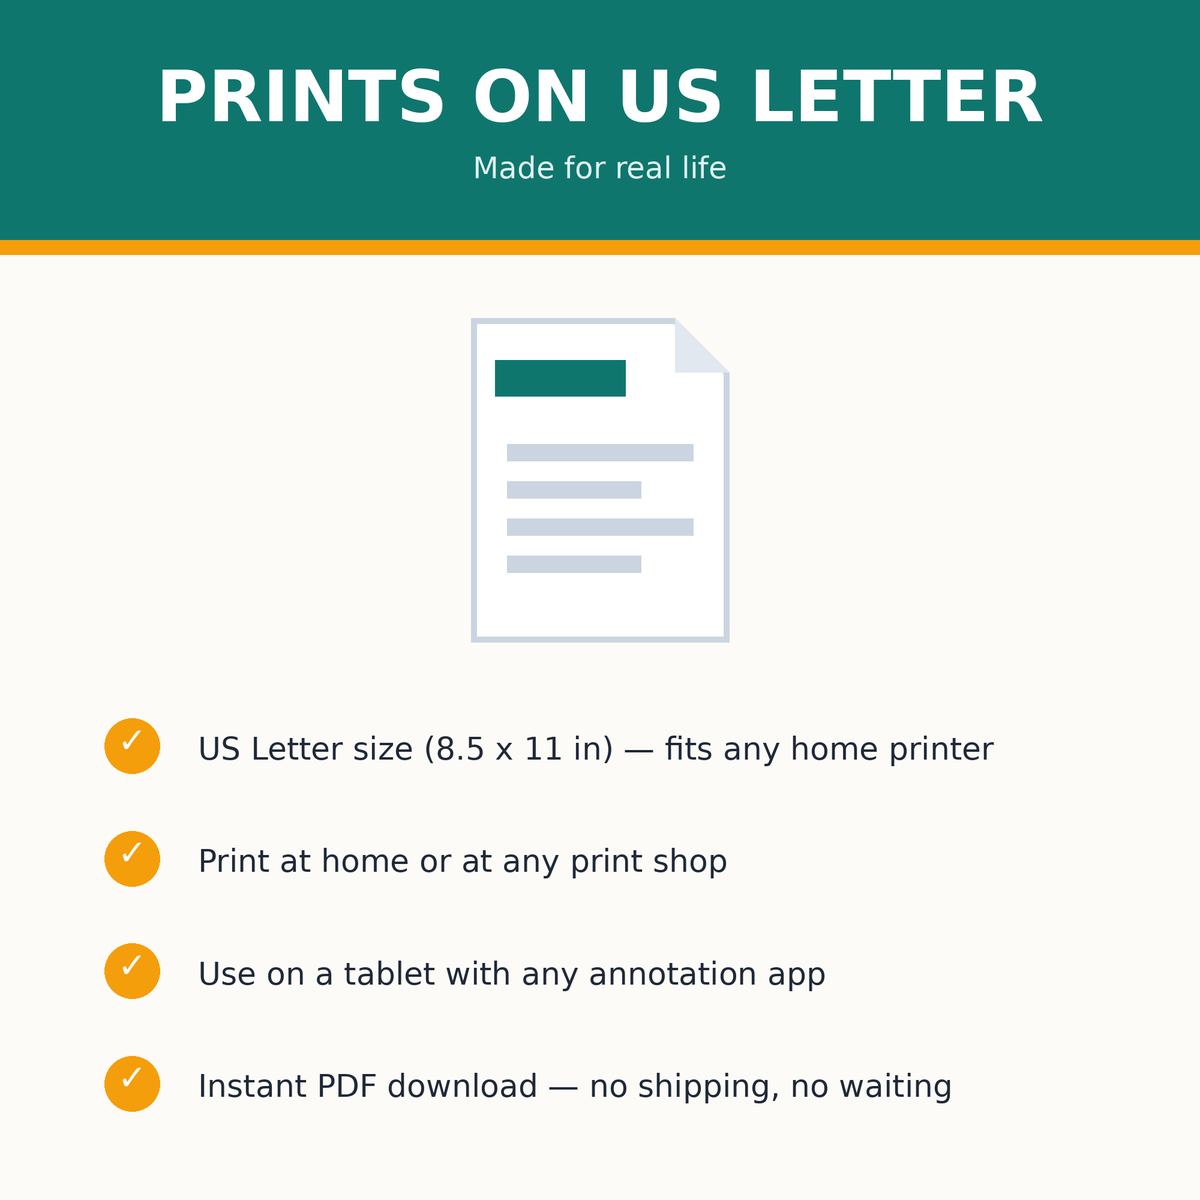
It is a printable PDF, and the hand plotted chart is the heart of it. Paper wins here. You can use it in a tablet app, but drawing the line by hand is half the point.
Planners from the same collection, built to work together.
Save $1,378 in 2027, one weekly deposit at a time.

Turn saving into a game you'll actually finish.
Split kid costs cleanly, with a record you can both trust.
Join the list and get the free monthly budget worksheet plus first word on new planners.
No spam, ever. Unsubscribe anytime.